
Casino maths, from first principles
How does the house edge actually work?
The percentage a casino keeps is not a mystery figure lifted from a marketing page. It falls out of the same true-odds-versus-paid-odds arithmetic in every game, and its short-run behaviour is almost the opposite of what the number suggests.
What the house edge is actually measuring
House edge is defined as the ratio of the average amount a player loses to the amount they wager on a single bet. Wizard of Odds, a reference site built specifically around this arithmetic, states it plainly: house edge figures are calculated against the initial bet, and they assume the player uses optimal strategy where a game allows a choice of play. A quoted 0.6% edge means an average loss of about six pence for every £10 wagered, taken over enough bets for the average to show itself.
That last clause matters more than the percentage itself. A house edge is a long-run average, not a per-spin outcome. No single bet resolves at "minus 6p"; it resolves as a win or a loss of a defined size, and the 6p only appears once you average across a great many such resolutions. Everything else in this article follows from taking that sentence seriously.
Sources: Wizard of Odds: house edge (accessed 19 September 2026).
House edge and RTP are not quite the same word
UK guidance on gaming machines uses a related but separately named figure: return to player, or RTP. The Gambling Commission describes RTP as "part of the money paid to play the machine that is then given back to the player as prizes," measured "as an average achieved over a significant number of game plays and not each time the gaming machine is played" — typically 10,000 or 100,000 games for a compensated machine, and more for a machine using genuinely random outcomes. Its own worked warning is direct: an 85% RTP machine should not be expected to return an average of 85p per £1 during any one playing session.
Where a payout structure is simple and has no bonus features, house edge and RTP are two ways of describing the same gap: house edge as a percentage of stake retained by the operator, RTP as a percentage of stake returned to the player, so that the two figures sum to 100%. The Commission's guidance treats them as describing different products, though — RTP for gaming machines, house edge for "bankers' games and games of unequal chance" where the house keeps a set percentage per hand or spin. Once bonus rounds, jackpot contributions or multi-line structures enter a game, a single quoted RTP figure no longer tells you the probability of any particular feature triggering, only the blended average across every possible outcome path. Treat the two terms as siblings describing the same family of gap, not as interchangeable in every case.
Sources: Gambling Commission: return to player (accessed 19 September 2026).
Where the gap comes from: true odds against paid odds
Every house edge in this article reduces to the same comparison: what a bet would need to pay to be exactly fair, against what it actually pays. Single-zero roulette has 37 pockets, so a bet on one number has a true probability of 1 in 37. A fair payout on a £1 bet would return £36 in total (£35 profit plus the stake back) — odds of 36 to 1. The wheel instead pays 35 to 1. The difference between the fair payout and the paid payout, spread across all 37 possible outcomes, is the house edge: 1⁄37, or 2.70%.
Double-zero roulette repeats the same logic with 38 pockets instead of 37. The wheel still pays 35 to 1 on a single number, so the gap widens to 2⁄38, or 5.26% — almost double, from adding one extra losing pocket to the wheel and changing nothing about the payout. This is the pattern behind every figure in the table below: count the true number of equally likely outcomes, compare it with what the game actually pays, and the edge falls out as arithmetic rather than a policy decision made about your specific account.
A comparison table, worked from published rule sets
The figures below come from Wizard of Odds' published house-edge reference, which documents the rule variant behind each number rather than quoting a single figure for an entire game. Two bets on the same wheel, or two total counts on the same dice, can carry very different edges.
| Game | Bet or rule variant | House edge | Where the gap comes from |
|---|---|---|---|
| Blackjack | Liberal Vegas rules, basic strategy | 0.28% | Combined effect of dozens of decision rules (splits, doubles, surrender); smallest published edge of a widely offered table game. |
| Baccarat | Banker bet | 1.06% | 5% commission taken on Banker wins offsets its higher win frequency versus Player. |
| Baccarat | Player bet | 1.24% | No commission, but a marginally lower win frequency than Banker. |
| Craps | Pass line / Come bet | 1.41% | 7-to-6 relationship between ways to roll a 7 and ways to roll the point numbers. |
| Roulette | Single-zero wheel, any inside or outside bet | 2.70% | 1 in 37 true odds against a 35-to-1 (or equivalent) paid payout — see the worked derivation above. |
| Roulette | Double-zero wheel, any inside or outside bet | 5.26% | 1 in 38 true odds against the same paid payout structure. |
| Caribbean Stud Poker | Standard pay table | 5.22% | Ante/raise structure plus a progressive-side-bet-style pay curve on the main hand. |
| Keno | Typical pay tables | 25%–29% | Wide draw pool relative to the numbers picked; among the highest published edges of any common casino game. |
| Slot machines | Reported range across machines | 2%–15% | Set by the paytable and reel weighting behind each individual machine; not disclosed on the machine itself and not derivable from play alone. |
Sources: Wizard of Odds: house edge (accessed 19 September 2026). Wheel Theory, Reel & Story and Jackpot Anatomy carry the fuller, game-specific derivations behind the roulette, slot and jackpot rows.
Variance: the spread nobody puts on the payout table
A house edge tells you the average result of a bet. It says nothing about how far any actual result is likely to sit from that average — that is a separate quantity called variance, and its square root, standard deviation, is the more intuitive figure because it is measured in the same units as the bet.
The general model for a repeated, independent trial is the binomial distribution: NIST's handbook gives its mean as np and its variance as np(1 − p), where p is the probability of the outcome being counted and n is the number of trials. A casino bet is not always a simple binomial trial — a single-number roulette bet pays 35 to 1 rather than a flat win or loss — but the same principle holds: variance depends on the full spread of possible payouts, not only on the probability of winning. A bet that wins rarely but pays a lot (a single-number bet) has a far larger standard deviation than a bet that wins often for a small, even payout (an outside even-money bet), even when both carry an identical 2.70% edge on the same wheel.
Sources: NIST: binomial distribution (accessed 19 September 2026).
Why the swings swamp the edge early on
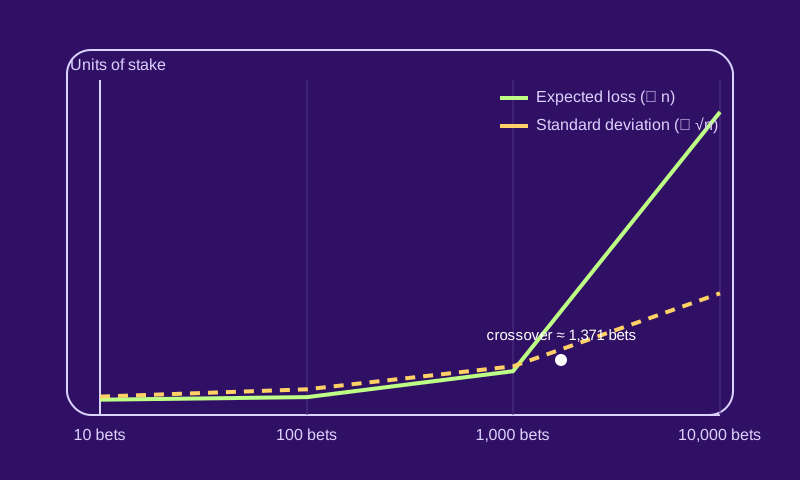
Put a number on that spread and the short-session behaviour of a house edge becomes far less mysterious. For n independent £1 bets, expected loss is simply n multiplied by the edge — it grows in direct proportion to how much you play. The standard deviation of the total result, by contrast, grows with the square root of n, multiplied by the per-bet standard deviation.
Take a single-zero even-money outside bet: edge 2.70%, per-bet standard deviation almost exactly 1 unit of stake (a bet that returns +1 or −1 has very little room for a wider spread). At 10 bets, expected loss is 0.27 units against a standard deviation of about 3.16 — the swing around the average is roughly twelve times the average itself. At 100 bets, expected loss is 2.7 against a standard deviation of 10: the swing has shrunk to about three-and-a-half times the average. Only past roughly 1,371 bets does expected loss overtake the standard deviation, and at 10,000 bets expected loss (270 units) is nearly three times the standard deviation (100 units). This is exactly what the figure above plots: a straight-proportion line eventually overtaking a square-root curve.
The practical reading is not that the edge is unreal — it is that a result measured in dozens or low hundreds of bets is dominated by variance, not by the edge that produced it. A losing session well beyond the theoretical average, or a winning one well past it, is ordinary behaviour for a process with this much spread relative to its mean at low bet counts. Neither outcome tells you the edge has changed.
Try it: the edge-versus-swing calculator
Explore the maths
Compare expected loss with the standard deviation of the result
Educational model: independent bets at a fixed edge and fixed per-bet spread. Standard-deviation multipliers are worked from each bet's own true-odds payout structure, not fitted to observed play. No real-money play; not a staking recommendation.
Independence: why a streak changes nothing
Everything above assumes each bet is independent of the last — that whatever happened on the previous spin carries no information about the next one. For UK remote gambling, that is not an assumption left to chance: the Gambling Commission's RTS7 standard requires random number generation and game results to be "acceptably random," demonstrated through statistical testing, with outputs that do not repeat or synchronise between instances and cannot be predicted in advance. RTS7 also explicitly bars "adaptive behaviour (that is, a compensated game)" — a game is not permitted to quietly shift its own odds based on recent results.
That requirement is what makes independence a reasonable working assumption for covered games, not proof that any specific product complies, and not licence to treat a visible losing run as informative. If each spin genuinely has no memory, a run of ten losses changes nothing about the eleventh spin's probability — the same complement-rule arithmetic covered in our separate note on "at least one" shows why a sequence looking overdue is a description of the past, not a forecast. A losing run also does not lower the edge working against you, and a winning run does not raise it; the edge is fixed by the rules of the game, independent of the account attached to it.
Sources: Gambling Commission: RTS7, generation of random outcomes (accessed 19 September 2026).
What this model does not cover
This article stays with the general mathematics that every game shares — true odds against paid odds, and the way variance behaves as bet count grows. It does not calculate the house edge, feature probability or paytable of any specific commercial slot, live table or jackpot product; those figures are set by each provider's own rule set and are not recoverable from the general formulas here, a limit the Gambling Commission's own RTP guidance acknowledges directly. It also does not model bonus terms, wagering requirements, stake changes mid-session or account-level behaviour, and it makes no claim about what any individual player will experience, win or lose. Our separate note on why an average is not a session forecast covers that distinction in more depth.
For the game-specific application of this same maths, Wheel Theory carries the full roulette probability derivations, Reel & Story covers slot RTP and volatility in depth, and Jackpot Anatomy explains progressive and fixed jackpot mechanics — each applying the general concepts on this page to their own territory rather than re-deriving them. If you are trying to work out whether you are spending more time or money than you intended, that is a different question from the maths here, and Play in Balance covers deposit limits, time-outs and self-exclusion as a player right rather than a probability question.
Methods & sources
- Gambling Commission: return to player — how much gaming machines pay out — accessed 19 September 2026
- Gambling Commission: RTS7, generation of random outcomes — accessed 19 September 2026
- Wizard of Odds: house edge — accessed 19 September 2026
- NIST: binomial distribution — accessed 19 September 2026